1. Torque, speed, current, voltage, power, power factor, power frequency meter and other interfaces are automatically collected by 485/232. Temperature and resistance are input into the computer through a keyboard, and the computer processes, displays, reports, fits curves, prints, etc.
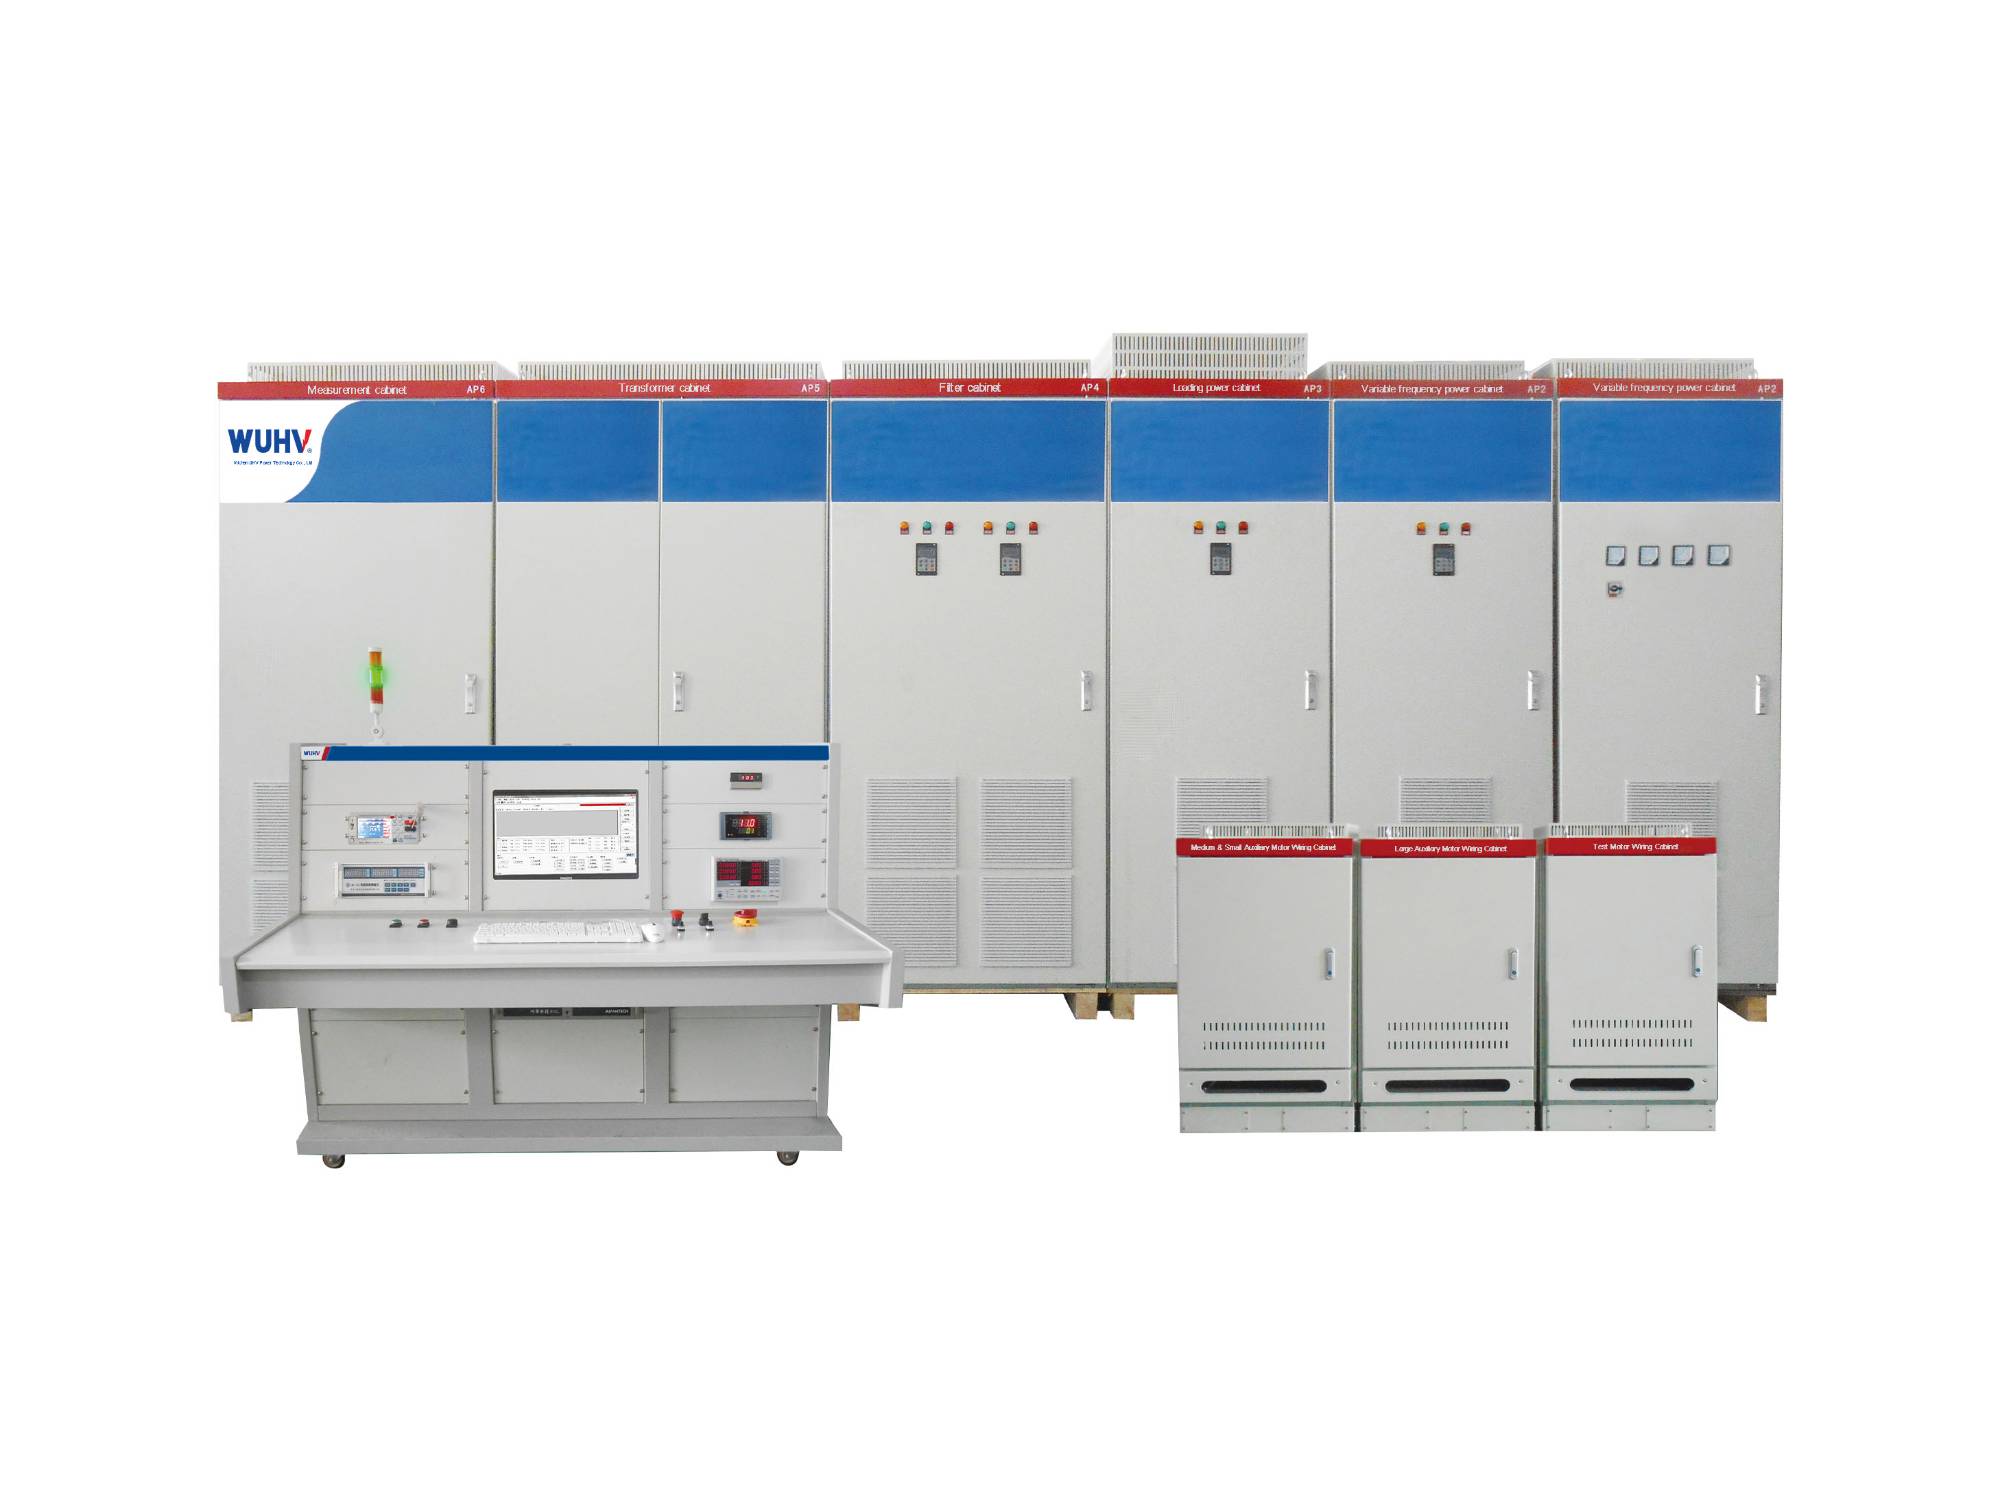
2. The asynchronous motor microcomputer testing system software has completed no-load test, blocking test, load test, temperature rise test, etc., and can automatically complete data reports and curves.
3. The software can process data through testing:
(1) Can conduct A and E method experiments
(2) The system is capable of conducting no-load tests, leakage tests, temperature rise tests, and load tests on single-phase and three-phase asynchronous motors.
(3) The system can display real-time motor three-phase voltage, three-phase current, input power, frequency, power factor, torque, speed, output power, and efficiency.
(4) The system can record real-time data during the temperature rise test process. It is divided into two methods: automatic collection and manual collection. Select automatic recording. Set the data recording time The system can automatically run and record data No manual recording is required. Select manual recording. It can be recorded as needed, collected by oneself, and recorded by oneself. When the temperature rise test is completed Stop the motor. Quickly collect resistance values using a resistance meter. Automatically generate a temperature rise report by saving data. The system for calculating temperature rise results can automatically store test data.
(5) The system can analyze and process the results of the no-load test, obtain the no-load current, no-load power, iron consumption, and mechanical consumption, and draw a curve graph. The following is the interface for no-load testing. According to national standard requirements. Change the no-load voltage. Collect 7 or more data points within the range of 1.25 to 0.5 times the rated voltage. Test completed Save according to data Automatically convert data collection points into no-load characteristic curves
(6) No load characteristic report Separate mechanical consumption and iron consumption through the no-load characteristic curve Obtain no-load current No load power Copper consumption without load. Balance of no-load current.
(7) The system can analyze the results of load testing to obtain full load current, full load power, full load efficiency, full load slip, and full load power factor, and plot them into curves. Load testing shall collect 6 or more data points within the rated load range of 150% to 25% according to national standards Automatically draw load curve Calculate using either the direct efficiency method of method A or the loss analysis method of method E.
(8) The system can analyze and process the results of the stall test, obtain the stall current and stall torque, and draw a curve graph. According to the national standard, the stall test should be conducted in accordance with the requirements of the national standard Adjust the locked rotor voltage through voltage regulation Block the motor with a mechanical device Quickly record a data point Control the motor start and stop through PLC Prevent the motor from overheating and burning out. Adjust the voltage collection point once. Collect at least 6 data points. Test completed. Click on 'Save Data'. Automatically generate a locked rotor characteristic curve.
(9) The system can perform mass spectrometry experiments. Draw the maximum torque point of the mass spectrum
(10) The system has a memory function for setting various parameters, which only requires one input.
(11) The system can print data and curves of the test results through a printer.
(12) The system can perform overcurrent and torque tests simultaneously. Provide noise input table
(13) After the experiment. Automatically perform data summary and analysis